U.S. Truck Accident Statistics by State - Infographic
This interactive infographic analyzes 25 years of commercial vehicle crash data from the Federal Motor Carrier Safety Administration (FMCSA), covering over 4 million incidents and 139,000 fatal crashes across the United States. Explore how truck accidents vary by state, time of day, weather conditions, and road surfaces. Discover that Texas accounts for 11.3% of all crashes, peak danger hours fall between 2-4 PM, and Tuesday is statistically the deadliest day for commercial vehicles. Whether you're a fleet manager, safety professional, or researcher, this data visualization reveals critical patterns in trucking safety trends.
Commercial Vehicle Safety in America
25 Years of Commercial Truck Crash Data from the Federal Motor Carrier Safety Administration
Where Crashes Happen
Geographic distribution of commercial vehicle crashes across the United States
Texas accounts for 11.3% of all commercial vehicle crashes—more than any other state. California and Pennsylvania round out the top three.
Most Crashes (Total)
Highest Fatal Rate
Interactive Map
Hover or tap states for detailsClick any state to explore detailed statistics below
25 Years of Trends
How commercial vehicle crashes have changed from 2001 to 2025
Crashes increased 55% from 2001 to 2022, but dropped 14% during COVID-19 in 2020. Fatal crashes reached their peak in 2022 with 6,133 deaths.
Annual Crash Trends
Explore Route Management Features
CurbWaste is here to help you grow and scale your business. Simple, intuitive and easy to use routing features are now a part of our dynamic, all-in-one platform.
Learn More →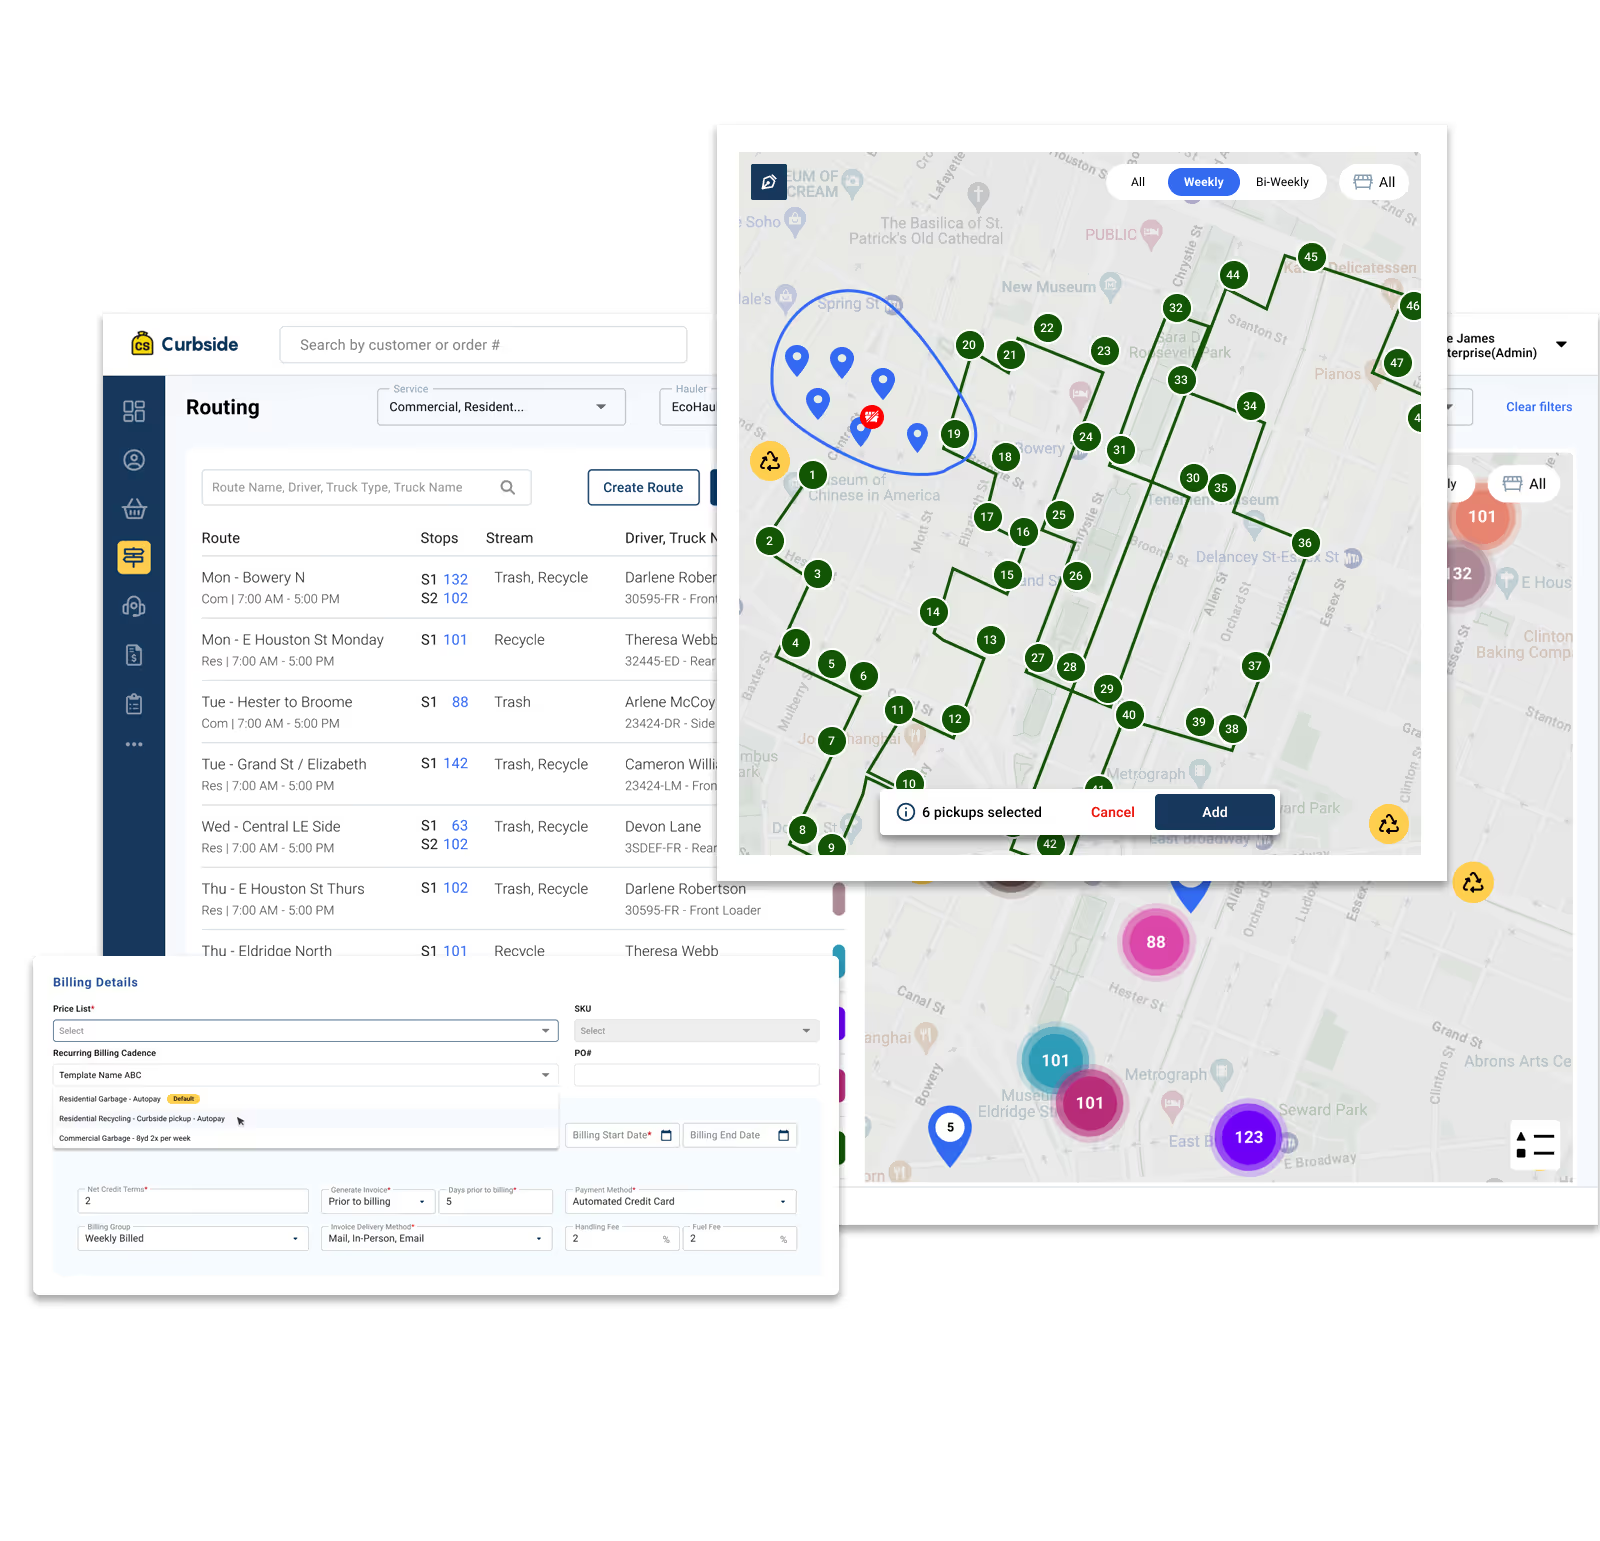
Crash Conditions
Understanding when crashes become fatal — weather, lighting, and road surface analysis
Fatal Rate by Condition
🌤️ Weather Conditions
💡 Lighting Conditions
🛣️ Road Surface
Risk Matrix: Frequency vs Severity
📊 Complete Risk Factors Table
| Condition | Type | Crashes | Fatal | Fatal Rate |
|---|
Ready to get started?
Meet the team to learn more about why CurbWaste waste management software has become the trusted partner for waste hauling businesses nationally.

.svg)