
Find your fleet size. Here is what your peers did.
Companies report their driver count when they update their federal filing (the MCS-150 form). We compared the 19,031 waste haulers that updated after April 2024 with their own earlier filing. Find your fleet size below: it is the peer group a lender, a buyer or a recruiter would compare you with.
Share of carriers that added vs. cut drivers
By fleet size in April 2024 · companies that updated their filing only · Apr 2024 → Aug 2026Net drivers added, by fleet size
Sum of driver-count changes across companies that updated their filing in each bandThe 1-to-4 band adds the most drivers in absolute terms because it has by far the most companies; its 28.6% net rate is a small-base effect (a two-driver shop hiring one driver is +50%). Only a third of that band refiled, so treat its growth figures as directional.
Among companies that updated their filing, 27% added drivers, 15% cut, and the rest held steady. Net, the industry's driver count grew 10.6% in 28 months, and the middle carried it.
Find your band on the left. At 15 to 50 drivers, 41% of companies your size added drivers and 31% cut, so a fleet that stood still is in the minority. At 51 to 100, more than half grew, the highest share of any band.
Above 100 drivers the pattern flips: more of those fleets cut than added, and the band lost drivers overall. For an independent, that is a hiring opportunity. The drivers leaving the big fleets are experienced, route-trained and CDL-holding, and they are looking in the same states where mid-size haulers are hiring fastest.
The pace is picking up
How much bigger fleets are than in April 2024
Percent change in drivers on file across seven federal snapshots · existing fleets = companies present in every snapshot · all carriers adds new companies as they registerA company that did not update its filing between two snapshots reads as unchanged, so the existing-fleet line is a floor. Companies that closed before August 2026 are not in either line.
Waste is out-hiring trucking at large
The same federal snapshots cover every motor carrier in the country. We ran the identical test on all 735,238 that updated their filing. Waste wins on every line, in every fleet-size band.
Your segment in ten numbers
Pick the business you are in. The register has no "line of business" field, so we sorted companies by the words in their registered names. It is imperfect, but it is the same test applied to every company, and it separates the industry into recognizably different businesses.
Dumpster & roll-off
All six segments side by side
Share of carriers · median fleet · growth among companies that updated their filing| Segment (name keywords) | Carriers | Share | Median fleet | Mean fleet | Registered 2020s | Added drivers | Cut drivers | Net growth |
|---|
Keywords: dumpster/roll-off/container · recycling/scrap · portable/toilet/septic/pump · junk/haul/removal · waste/disposal/sanitation/garbage/refuse/trash/rubbish. A name matching two lists is assigned to the first in this order. "Other" is every carrier whose name contains none of them, typically a surname plus "LLC" or "Trucking"; they were admitted to the universe by cargo flag or website classification.
The biggest surprise in the register is the liquid side: septic and portable-toilet operators outnumber dumpster companies two to one, and they are the smallest businesses in the industry. Growth concentrates in the names that say "waste." Junk removal and dumpster rental are the youngest segments, with well over half of their companies registered in the 2020s.

Waste management software by haulers, for haulers
CurbWaste was built by industry veterans who understand the difficulties of running a waste business firsthand. Dispatch, billing, routing, and asset tracking in one platform, so the 15-to-100 driver haulers doing the hiring in this report can keep growing without adding office headcount.
GET DEMO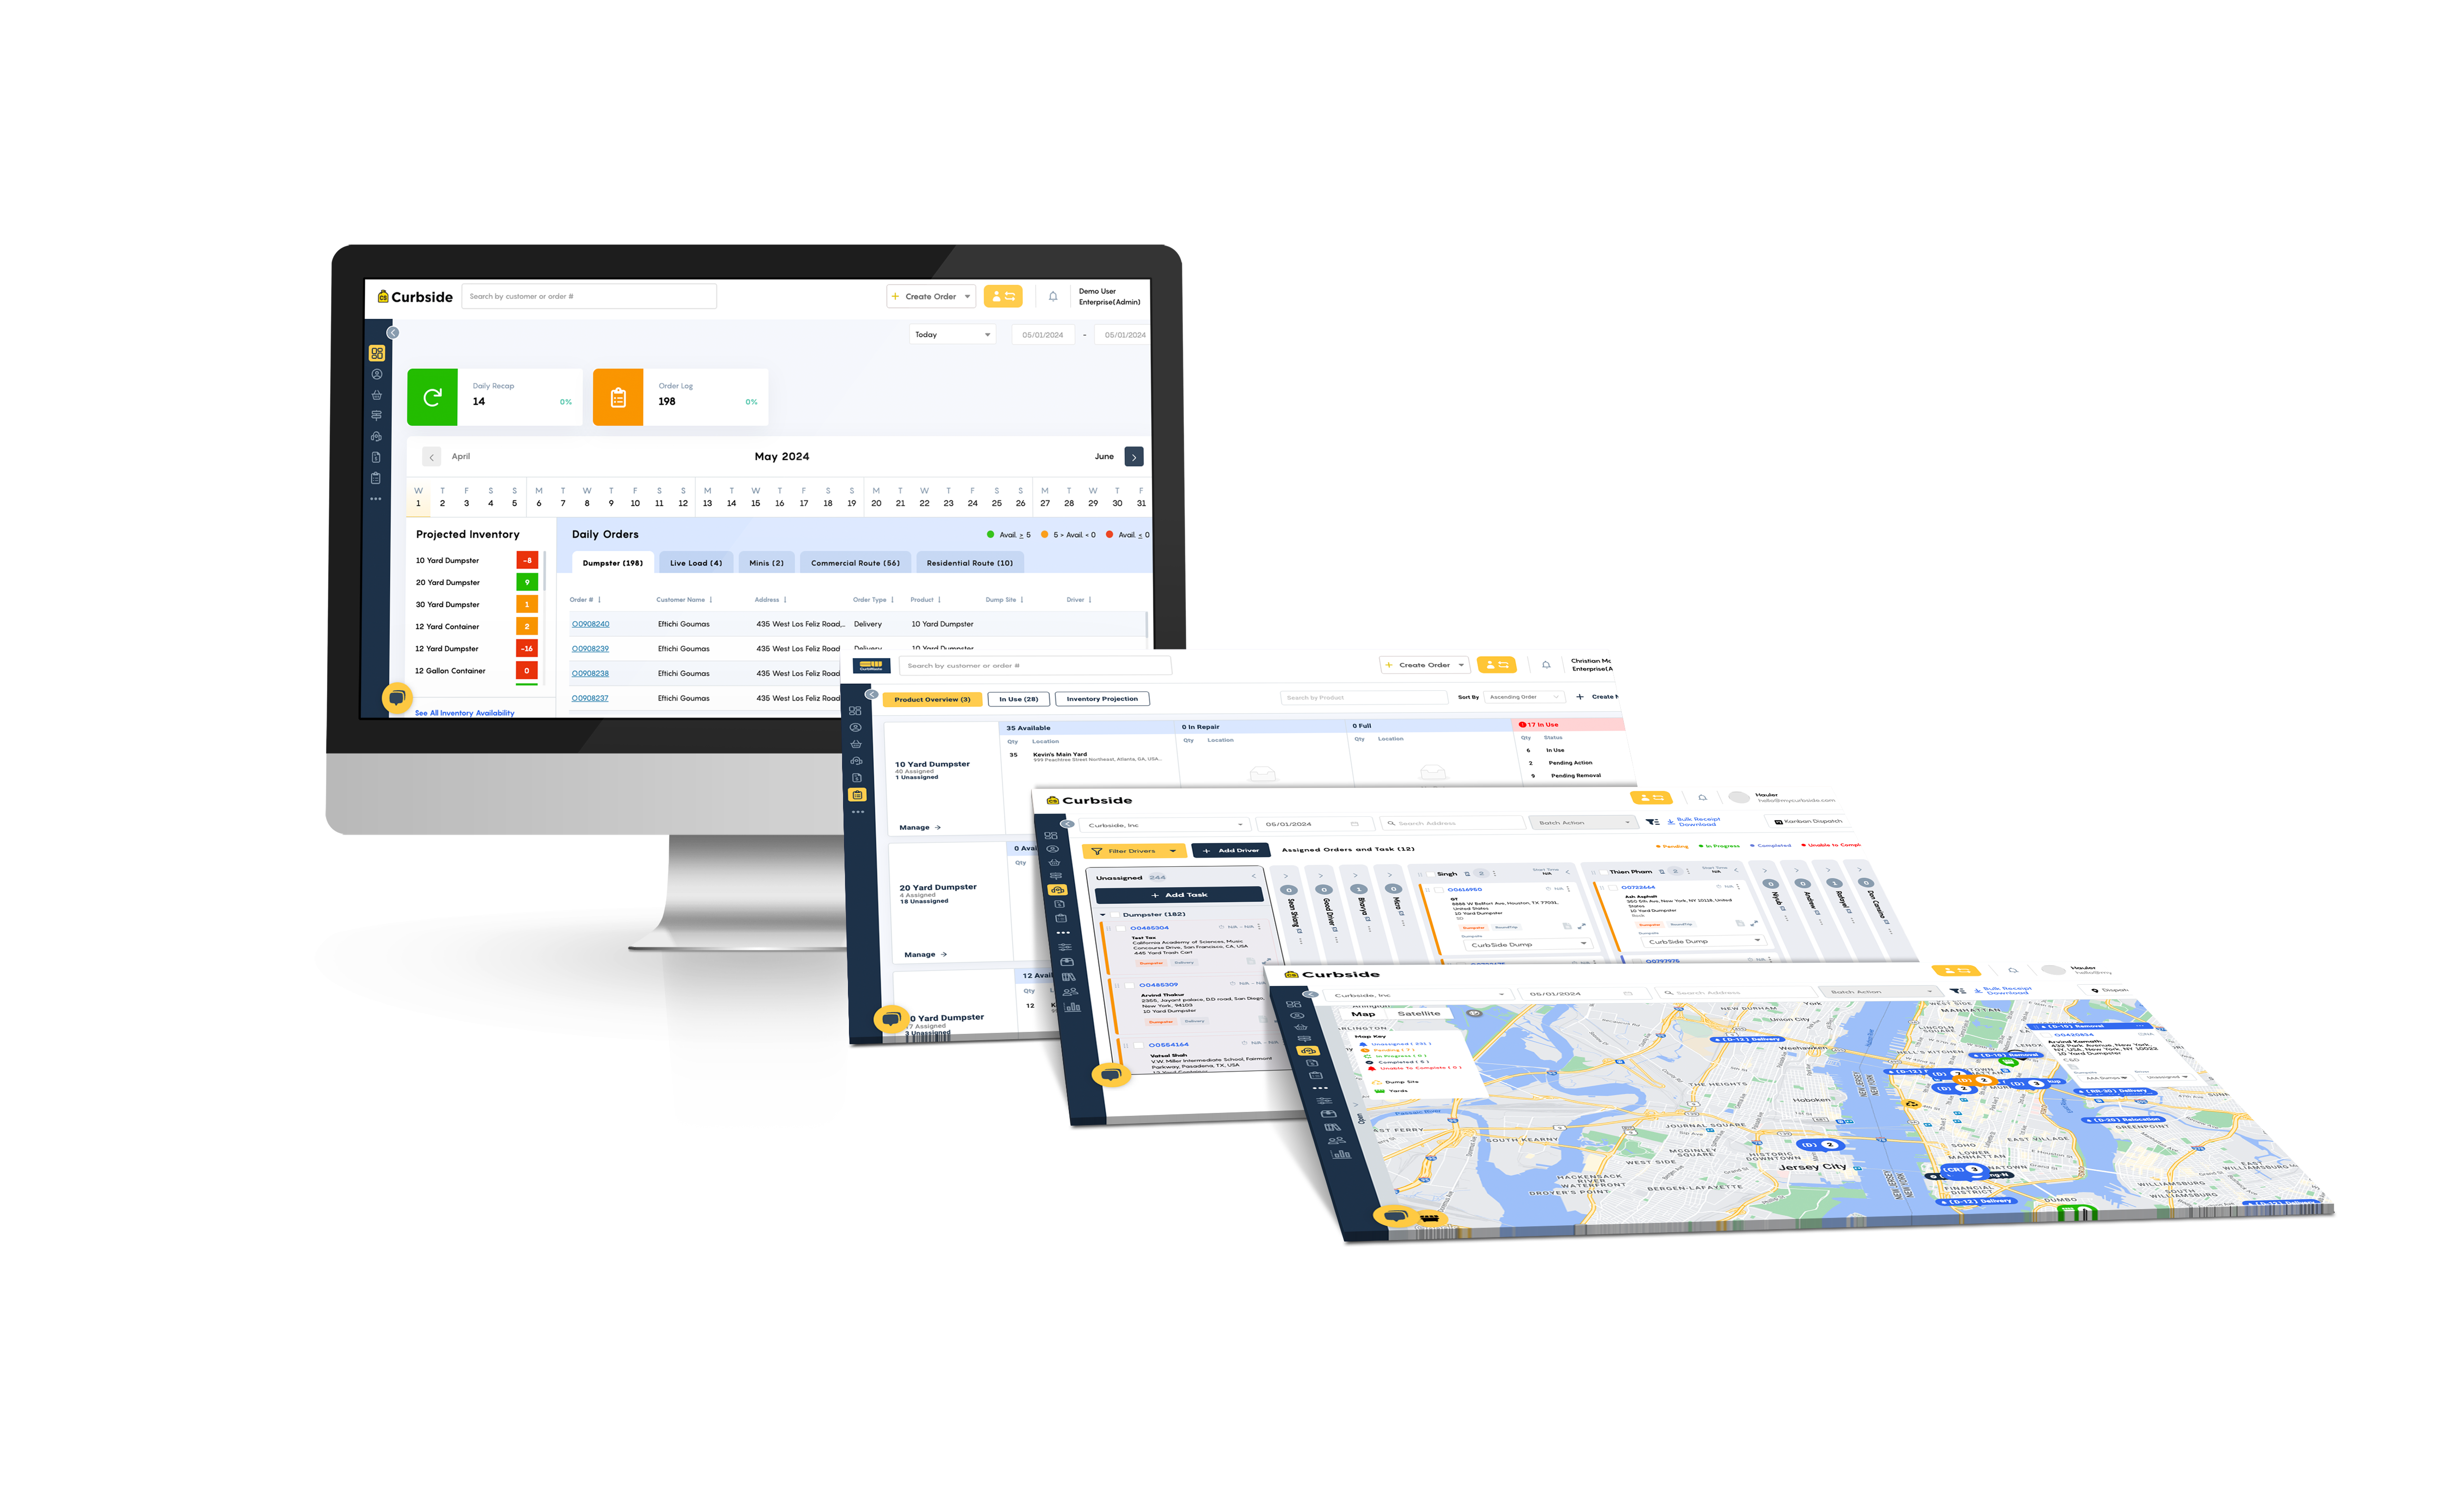
Where the haulers are, and where they are hiring
California, Florida, Texas, New York and Georgia hold the most registered waste carriers. Per resident, the map flips: Wyoming, Maine and Nebraska have five to six times the carrier density of Illinois or Virginia. Toggle the metric to see each view.
Texas added the most drivers. Illinois and the Carolinas grew fastest.
Drivers added by companies that updated their filing, April 2024 to August 2026. Three states shrank. States with too few updated filings are left out of the rankings.
Net drivers added, top 10 states
Sum of driver-count changes across updated-filing waste carriers · rate in parenthesesStates that lost drivers
Every state with a negative net change (100+ companies that updated their filing)Texas added the most drivers of any state, on a growth rate well above the national line. Illinois, North Carolina, Indiana and Georgia grew fastest among the large states. California added plenty of drivers, but only at the pace of trucking overall.
The shrinking states are a smaller story. Arizona lost drivers despite Phoenix being the most fleet-heavy metro in the country, because it is also home to a dozen fleets over 100 drivers, and that is the band that shed people everywhere. Idaho and Arkansas are the other two.
We tested whether driver growth follows construction. It does not: a state's change in housing permits has no relationship with its driver growth, and neither does population growth. Waste demand follows the homes and businesses that already exist, not the ones being built.
Top 25 cities by registered waste carriers
Physical-address city on the carrier's federal filing · click a column to sort| City | Carriers | Drivers | Mean fleet | Fleets of 15+ |
|---|
Houston has the most registered waste carriers of any city, but Phoenix has the most drivers by a wide margin: 262 carriers running 4,072 drivers, a mean fleet of 15.5, against a national mean of 4.7. Los Angeles and Miami are the opposite, hundreds of carriers averaging fewer than three drivers each.
One in three of these haulers did not exist in 2019
Every DOT number carries the date it was issued. Counting today's active waste carriers by the year they registered shows a wave of new entrants that started in 2021 and has not crested.
Active waste carriers today, by year of DOT registration
Carriers still active in August 2026 · 2026 covers January–August onlySurvivorship shapes this chart: older cohorts have had more years to exit, so early years are understated relative to recent ones. The 2021 step-up against 2016–2019 is only two to five years apart, which survivorship alone does not explain. 2015 shows an isolated spike (3,189 registrations) that does not continue into 2016; we could not attribute it and show 2016 onward.
Who the newcomers are
Share of today's carriers and drivers by registration eraCarriers registered in the 2020s are 34.1% of companies but 23.0% of drivers. New entrants come in small, and the register's 2 driver median is partly a story about how young the industry's long tail is.
From 2016 through 2019 the register gained roughly 1,500 waste carriers a year that are still active today. Since 2021 it has run above 2,300 a year, and 2025 produced 3,272, the largest cohort on record. Consolidation at the top and formation at the bottom are happening at the same time: the number of companies is not falling, the market is churning, and the churn feeds the middle bands that are doing the hiring.
80% of the companies, 31% of the drivers
Sort every company by fleet size and the shape is a long tail with a heavy head. These are the six size bands used throughout this report.
Share of carriers vs. share of drivers, by fleet size
Percent of all 48,091 registered waste carriers and all 227,079 drivers · August 2026The band that matters most to anyone selling into this industry is the middle. Carriers running 15 to 50 drivers are 4% of companies but nearly a quarter of the drivers, the largest block of labor outside the 1-to-4 tail. At the other end, four in ten registered haulers report exactly one driver: a single roll-off truck, septic pumper or junk box truck with the owner behind the wheel. They are the reason every payroll-based count of this industry comes up tens of thousands short.
Fifty states, five datasets, one table
Every state on one table: the register, the trucking benchmark, Bureau of Labor Statistics jobs and wages, OSHA injury rates and Census population. Click a column to sort; the six that matter most are shown first.
| State | Carriers | Drivers | Growing % | Driver growth | New since 2024 | Per 100K | Median fleet | All-trucking growth | Reg. 2020s | BLS waste jobs | Refuse collector wage | Injury rate |
|---|
Drivers on the DOT register and BLS waste-collection employment measure different things: the register counts drivers at any registered carrier, including septic, junk and recycling companies; BLS counts payroll employees at establishments coded NAICS 5621 Waste Collection, and excludes owner-operators. Where the register shows more drivers than BLS shows employees, the gap is mostly single-driver businesses BLS never sees. For what drivers and collectors are paid in every state and metro, see our companion report, the Waste Industry Salary Atlas.
Waste management software by haulers, for haulers
CurbWaste was built by industry veterans who understand the difficulties of running a waste business firsthand. Dispatch, billing, routing, and asset tracking in one platform, so your team spends less time in windshield chaos and more time running profitable routes.
GET DEMOReady to get started?
Meet the team to learn more about why CurbWaste waste management software has become the trusted partner for waste hauling businesses nationally.
.svg)

.svg)