
Waste Management Software ROI: What It's Actually Worth
A conservative model of what operations software is worth to a 5-to-20 truck hauler: about 4% of revenue, and 84% of it in the office, not on the truck.
You can add another truck.
You can’t add another you.
Trucks are the easy part. You can finance one, hire for it, and have it on a route this quarter. The office is where growth actually stalls — and the cost of that shows up in half a dozen specific places: work that never got billed, invoices that leave four days late, cash parked in receivables, and one or two people absorbing everything the fleet throws at them. On a six-truck operation it comes to about $84,000 a year and 35 office hours a week — the margin you would earn on roughly 13% more work, without buying a truck, hiring a driver, or winning a single new customer. The arithmetic is below, and you can check it against your own books in an afternoon.
Between five and twenty trucks, the office breaks before the fleet does.
The most under-served band in the industry — and the reason is structural, not anything you did wrong.
The owner takes the calls, knows every can, and remembers who hasn’t paid. A phone, a whiteboard and an accounting package are genuinely enough — one head is holding the whole operation.
Far too much for one person to carry, and not yet enough scale to justify hiring the three people who would carry it properly. So one or two absorb everything — using tools never designed to be a system of record.
Solved by force. A dispatcher, a billing clerk, someone who owns collections — and a system bought at some point, because the alternative had become impossible.
In the middle band the whole operation runs on a spreadsheet, a shared inbox, a whiteboard, an accounting package, a text thread with the drivers — and the owner’s memory as the index to all of it. That arrangement does not fail loudly. It leaks.
- A rental day nobody logged
- An invoice that sat four days because the ticket was in a truck
- A customer who called twice and got voicemail
- A driver sent to an address that was already serviced
None of these is a crisis, and none of them shows up as a line on your P&L. Together they are why the business feels considerably busier than the margin suggests it should be.
The tell. If growth means adding office hours rather than adding trucks — if the answer to “can we take on twenty more accounts” is a question about the office rather than about the yard — you are paying this cost already. You are just paying it in overtime, in the owner’s evenings, and in the jobs you turned down.
Six leaks, and only one of them is on the truck.
Software in this category is sold on routing, because routing demos well. The money is somewhere else.
Everything below is modelled on one operation we will use throughout: six trucks, fourteen jobs a day, six days a week, $475 average job value — about $2.07M a year. If you run more trucks, section 04 scales it. Every assumption is printed in the appendix so you can argue with it.
Where the money goes on a six-truck operation
Annual, conservative method · capacity gains excluded · dollars per yearThe amber bar is the only truck-side item. Everything else happens between the phone ringing and the payment clearing — 84% of the total. Unbilled work is the one line nobody can benchmark for you, so the next panel shows exactly how we built it and how to replace it with your own figures.
How we sized the unbilled work
Four assumptions, all replaceable · six-truck operation · 4,368 jobs a year| Jobs a year | 4,368 | From 14 jobs a day, six days a week |
| Share carrying a billable extra | 20% | Extra rental days, dry runs, overweights, trip fees, contamination |
| Average value of one extra | $85 | A dry run typically runs $75–150, an overweight ton $65–95, an extra rental day $10–25 |
| Share that never reaches an invoice | 20% | The number to argue with. Independent benchmarking puts invoice exception rates at 14% on average and 22% among the weakest performers |
| Unbilled today | $14,851 | 0.72% of revenue · $3.40 a job |
| Share recovered by capturing extras in the field | 75% | Not everything — some extras are judgement calls or waived to keep a customer |
| Recovered per year | $11,138 | $2.55 a job |
We chose a middle estimate rather than leaving this at zero, because zero is not a neutral choice — it quietly asserts that nothing is being missed. But this is the one line you can settle for yourself in an afternoon: pull one month of tickets, pull the same month of invoices, and count what was earned and never charged. If your answer is materially different from $3.40 a job, use yours.
Why routing is the small one. A 2025 meta-analysis pooled eleven studies of waste-collection route optimisation. Simulated results averaged a 39.8% distance reduction; real-world deployments averaged 12.4%. Modelled routing savings run about three times what anyone actually banks.
The operators’ own numbers agree. Waste Management told investors that efficiency gains of 3–4% across three years were worth roughly $100M against its entire business, and in 2026 put the margin contribution of AI routing across its ~14,000-truck fleet at 50 to 60 basis points. That is the largest hauler in America, with the best routing money can buy, describing half a percentage point. Buy software for the office. The routing is a bonus.
Follow one job from the phone call to the deposit.
This is the whole product argument, and it has nothing to do with dashboards. It is about how many times a single job gets touched.
Written on a pad, re-typed into the schedule, then re-typed again into accounting. Three entries, three chances to get the address, the size or the price wrong.
Entered once — or not at all, if the customer books it online. Everything downstream reads from that one record.
Where every can is, which are coming back, who promised what — all in one person’s head. They can’t take a week off, and nobody else can answer a customer.
Can location and status on a screen anyone can read. The knowledge stops being a single point of failure.
Paper tickets travel at the speed of the truck. A job finished Tuesday morning may not reach the office until Wednesday night.
The driver confirms the job, the weight and the photo from the cab. The office knows it is done before the truck is back.
Rental days, dry runs, overweights, trip fees, contamination. Each one depends on somebody remembering to write it down — and somebody else remembering to bill it.
Recorded at the moment it occurs, and on the invoice without anyone having to decide to add it.
Billing is a Friday afternoon task, done days after the work and posted as a statement.
An emailed invoice with a payment link. Top-quartile receivables teams run 48% lower DSO and 48% fewer billing errors than the median.
Where is my can, what do I owe, when are you coming — every one of those is a phone call, and some of them go to voicemail.
They look it up. Your office answers the calls that actually need a person.
Nothing above is exotic. There is no artificial intelligence in that list and no transformation programme. It is the same six steps you already perform, with the re-typing removed and the paper delay taken out. That is the entire mechanism, and it is why the benefit shows up as office hours and faster cash rather than as fewer miles.
About 4% of revenue, before anything speculative.
Conservative on purpose: the capacity lever is switched off, unbilled work is sized at the low end of a range you can verify yourself, and the AI roadmap counts for nothing.
$2.07M of revenue. The worked example throughout this paper.
$3.46M of revenue, at the same share.
$5.19M of revenue, at the same share.
$6.92M of revenue, at the same share.
Another way to hold that number. At fifteen trucks, $209,335 is the contribution margin on about 1,470 additional jobs — roughly 13% more work than you run today. The difference is that you do not have to go and win it, service it, or buy a truck to carry it.
How to read the scaling. Only the six-truck figure is modelled line by line; the others hold the same 4% of revenue and assume revenue per truck stays constant. Real operations vary — and in this band admin cost tends not to rise in step with fleet size, which is exactly the leverage this argument is about. Treat the larger figures as a straight-line guide, then run your own numbers using section 07.
Two things that sit outside that figure
- $38,370 of cash, released once. Collecting fifteen percent faster on a 45-day days-sales-outstanding frees about six and a half days of revenue out of receivables. That is real money and it is genuinely useful — but you free it once, not every year, so it does not belong in an annual figure. Most calculators put it there anyway.
- $37,335 of capacity value, if and only if you can sell it. Tighter dispatch can find roughly 262 more pulls a year in the same fleet. Those are worth contribution margin, not revenue, and they are worth nothing at all unless you have demand waiting or a truck purchase to defer. We leave this out of the headline because most operators cannot name that demand when asked directly. If you can, add it.
Include the capacity line and the six-truck figure becomes $121,069 — 5.8% of revenue. We lead with the smaller number because it is the one that survives a sceptical conversation.
And the part that is not money
The same model returns about 1,807 office hours a year on a six-truck operation — roughly 35 hours a week. Whether that reads as a saved salary, a hire you do not have to make, or the owner getting their evenings back depends entirely on your situation. It is the same hours either way, and for most operators in this band it is the part that actually changes how the business feels.

Waste management software by haulers, for haulers
CurbWaste was built by industry veterans who understand the difficulties of running a waste business firsthand. Our all-in-one platform handles customer management, dispatch, and billing — so you can focus on what matters: service, speed, and scaling your business.
GET DEMO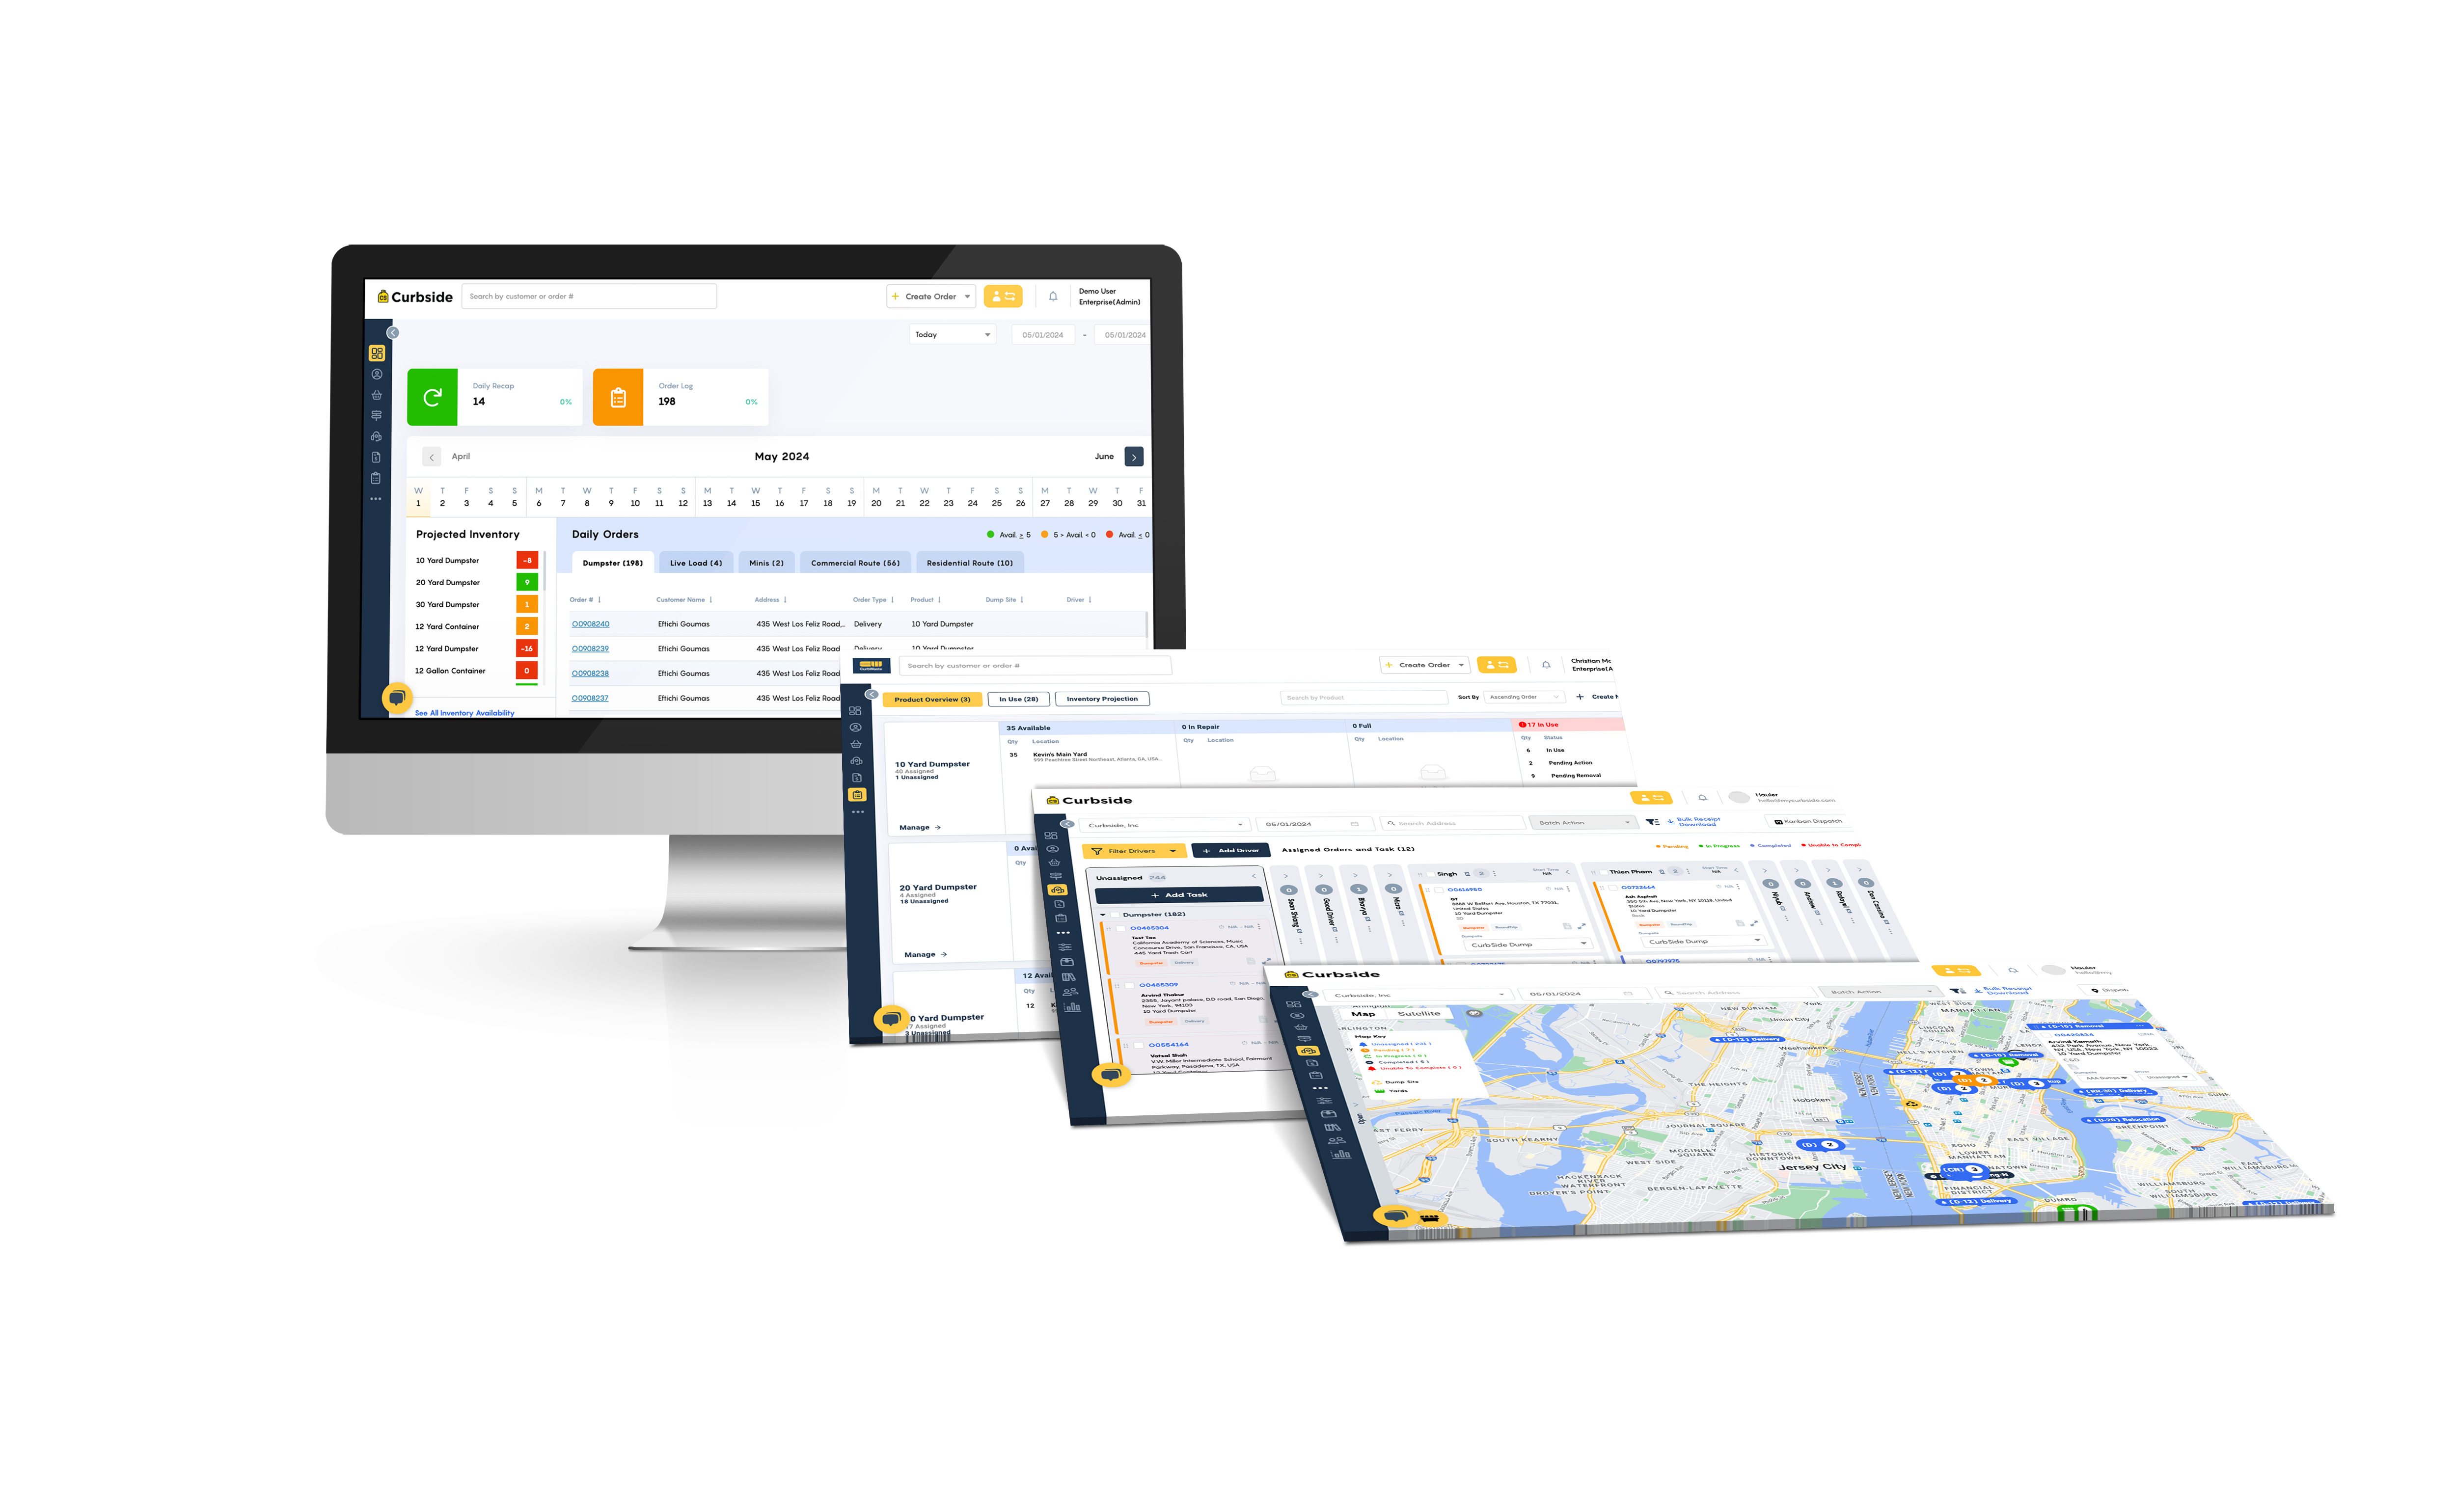
Because it is far smaller than the ones you have been shown.
You have every reason to discount a figure produced by a company that wants to sell you something. Here is what we did about that.
How long payback actually took, according to buyers
Roughly 5,270 software purchasers reporting their own payback period · fleet and field-service categories, 2026Nearly one buyer in five lands in a bucket that includes never paying back. That is the number worth holding on to, because no vendor will ever show it to you. By contrast, the analyst-branded studies published on software of this kind report three-year returns ranging from 106% to 1,342% — a twelvefold spread in a figure that is supposed to be comparable, driven largely by who commissioned the study. Not one of them models the 18%, because a composite company built to demonstrate value does not contain the customers it failed. No equivalent buyer data exists for waste software specifically; these are the closest adjacent categories.
The four things we did differently
- Extra jobs are valued at margin, not revenue. An additional pull is not free money — it burns fuel and a disposal ticket. Counting the full ticket price overstates that line more than threefold.
- Freed cash is reported once, not annually. You release the receivables balance a single time. Only the carrying cost of that capital recurs. Treating the whole balance as an annual saving inflates the line more than twelvefold.
- Retention is measured against customers who actually leave. You cannot retain someone who was never going anywhere. Waste Management discloses annual churn of about 10%, so the population in play is roughly a tenth of your book — and it is worth what replacing a customer costs, not their lifetime revenue.
- Overlapping savings are counted once. Faster billing and less admin time are largely the same hours. Applying both to the full admin budget spends the same money twice.
Applied to the same six benefit lines on the same operation, those four choices are the difference between $622,765 and $72,596. Same trucks, same assumptions, nearly nine times apart. We publish the small one. (Unbilled work sits outside that comparison — neither method above attempts to model it, which is why we built it separately in section 02.)
And ignore the ROI percentage — including ours. Divide any of these benefits by what the software costs and you get a return in the hundreds of percent. That is a statement about how cheap the software is relative to a multi-million-dollar operation, not about how good it is. Judge it as a share of revenue. 4% is the honest headline, and it is a demanding claim: it says roughly one dollar in twenty-five currently leaks out of this operation. Ask whether you believe that about yours.
A cheaper platform isn’t a cheaper decision. It’s a shorter one.
Every figure in this paper assumes you still have the system under you in year three. An annual benefit only compounds if the platform lasts — which makes the length of the decision matter as much as its price.
There is a new category of hauling software built quickly with AI tooling and sold for around a hundred dollars a month. For plenty of operations it is the right answer, and this section says so further down. Be suspicious of it anyway — this is the one place in the paper where we have something obvious to gain. Judge the logic, not the source.
You are not choosing between an expensive platform and a cheap one that does the same job. You are choosing between one migration and two — and the monthly price is the only part of that comparison you can see when you sign.
A feature list compares breadth. You get hurt on depth.
Both products tick the same boxes. The boxes are not the work.
It produces a PDF.
A job split between a general contractor and a homeowner. A credit for a can collected four days early. A rental that crossed a rate change mid-month. Disposal taxed differently from hauling.
It draws a list.
Knowing the can is still on the ground because the driver couldn’t get down the driveway — and that the standby time is billable.
Complexity here never lives in the ordinary job. It lives in dry runs, relocations, weight disputes and contaminated loads — and software written quickly is written for the ordinary job, because that is what demos well.
What outgrowing one actually costs
The line item nobody prices before signing
- Your history may not travel
Ask specifically about job history, service photos and weight tickets — not just a customer list. What stays behind, you keep paying to keep readable.
- Payment methods usually can’t move
Card credentials sit with the processor, not the software, and rarely port between them. In practice every autopay customer gets re-collected.
- You onboard twice
Same mapping, same testing, same training — the second time with an office that has become cynical about new software.
- Every integration is rebuilt
Accounting, payments, telematics, the scale house. You pay for that work again every time you change platform.
When it is the right call — often. Under about five trucks, one line of business, simple billing and no integrations worth the name, a lightweight platform will serve you well. Two or three good years at that price is a fine outcome. The mistake is not choosing it; it is choosing it without knowing you are choosing a temporary answer, then meeting the exit price at the exact moment you can least afford a disruption. Durability matters too: a hundred dollars a month funds a small team, and you may end up migrating on their timetable rather than yours.
And yes, all of this applies to us. We are a switch too — same migration, same re-collected payment details, same rebuilt integrations. We are not exempt from our own argument. What differs is how often you pay it, so the question worth asking any vendor, us included, is not “is this cheap” but “is this the last one for a while.” Ask us the export questions. Ask who holds your payment tokens. We would rather answer now than have you find out in three years.
Four numbers, one afternoon.
You do not need a consultant. You need four figures you already have and a willingness to be unimpressed.
- Jobs per day, and days per week you actually run. Not calendar days. A six-day operation works 312 days a year, not 365 — a model using the calendar overstates everything downstream by 17%.
- Average revenue per job, and your disposal cost per job. The gap between them is the only correct multiplier for any capacity claim.
- Monthly admin, labour and fuel spend. Straight off the P&L. Admin is where most of the benefit lands, so get that one right rather than estimating it.
- Your accounts-receivable balance. If you do not know your days-sales-outstanding, divide A/R by annual revenue and multiply by 365. Close enough to model with.
Five questions for any vendor, including us
- Does it ask my disposal cost?
If it takes average job value but never asks what a job costs to service, added capacity is being booked at full revenue.
Look for: a margin or cost-per-job input somewhere in the form. - Is the collections benefit annual or one-time?
You release the receivables balance once. If the whole balance appears inside an annual total, that line is badly overstated.
Look for: freed cash reported separately from the recurring figure. - Can I switch off the capacity lever?
It is usually the largest line and always the least certain. A model that will not let you remove it is not letting you test the answer.
Look for: a toggle, and a default that starts switched off. - Do my answers change the output?
Uncheck a problem you do not have and watch the total. If it does not move, the questions were decoration.
Look for: the number falling when you say something is already fine. - What share of my revenue is this?
The most useful question, and the one no calculator asks itself. Divide the benefit by your top line.
Look for: low single digits. Anything above 10% needs a very good story.
Then decide in this order
- Size your admin spend first. It is the largest channel by a wide margin. If your office is genuinely lean — one part-time bookkeeper, an owner who does not touch dispatch — the case here is much weaker, and you should know that before anyone demos anything.
- Audit one month of invoices against one month of tickets. Everything else in this paper is modelled; this one you can measure. It is the fastest way to find out whether our figure is conservative or generous for your operation — section 08 shows how to read the answer.
- Ask for a reference at your size. Not a national hauler. Someone between five and twenty trucks who switched in the last two years, and ask them what the first ninety days were like.
- Judge the result on cost per booked job and days to invoice — two numbers you can measure before and after — rather than on whether the dashboards look good.
Why this is worth doing.
Not because software is exciting. Because at your size, the alternative has a cost that grows every time you add a truck.
Rising to about $209,000 at fifteen. Capacity gains excluded.
A hire you do not make, or your evenings. Same hours either way.
Roughly one dollar in twenty-five, currently leaking out.
Three reasons, beyond the number
The parts that never show up in a benefit calculation
The second is the one operators underrate, and it is the argument for acting now rather than at twenty-five trucks — you get the leverage during the years you are actually growing.
When not to do this. If you run fewer than five trucks and the owner still touches every job, a lightweight platform will serve you for now — as section 06 says. Plan on needing more before you hit ten. If your office is genuinely lean, one part-time bookkeeper and no dispatch overhead, the largest channel in this paper is small for you and the case is correspondingly weaker. And if you already run a system that captures extras in the field and invoices the same day, you have solved this. Any vendor who tells you otherwise is selling, not advising.
The thing you are actually worried about
It is usually not whether the money is there
Half your drivers have been doing this for twenty years on paper, and one of them has a flip phone.
Put two trucks on it before fifteen. Drivers who see it end their day earlier convince the rest far better than you can. If two trucks will not adopt it, you have learned that cheaply.
The two people already absorbing everything are the two who would have to carry a migration on top of it.
True, and it is the best argument for doing it now rather than later — that office only gets more overloaded from here. The cost is front-loaded: you pay it once, unlike the leak.
You run routes six days a week. A bad cutover means missed pickups and jobs that never get billed.
So do not cut over in one go. Run billing in parallel for a cycle and reconcile the two before you switch anything off. Sequenced, the risk is bounded; done as a big bang, it is not.
We are not going to tell you it is painless. It is a real project, it lands on people who are already busy, and anyone promising you a date before they have seen your data is guessing. What we will say is that the disruption is bounded and happens once, while the cost in section 02 recurs every year and grows with the fleet. That is the whole trade, and it is the only honest way to frame it.
Pull one month of driver tickets and the same month of invoices. Count what you earned and never charged, then divide by the jobs in that month.
If your answer is close, the rest of this paper is roughly right and the decision is not a close one. If it is double, the case is stronger than anything written here — and you found it yourself, without trusting a word we said.
Waste management software by haulers, for haulers
CurbWaste was built by industry veterans who understand the difficulties of running a waste business firsthand. Our all-in-one platform handles customer management, dispatch, and billing — so you can focus on what matters: service, speed, and scaling your business.
GET DEMOEvery number above, and where it came from.
If you want to check our arithmetic or hand it to your accountant, it is all here. If you don’t, you already have the argument — nothing below changes it.
The operation modelled: six trucks, 14 jobs a day, six days a week, $475 average job value — 4,368 jobs and $2,074,800 of revenue a year, against $972,000 of operating cost (labour $696,000, fuel $114,000, maintenance $72,000, admin $90,000). Every cost saving below applies to one of those four bases; unbilled work is recovered revenue rather than a cost reduction. Operating days are 312, never the 365-day calendar.
The rates are round illustrative figures chosen so the arithmetic is easy to follow and easy to challenge. They are not drawn from any vendor’s pricing or published model. Where a figure can be checked against an outside source, that check is in the right-hand column.
| What we assumed | Rate | Outside check |
|---|---|---|
| Back-office time reduction | 30% | Independent AP benchmarking puts best-in-class invoice cost at $2.78 against $12.88 for everyone else, and processing time at 3.1 days against 17.4 — a far larger gap than we credit |
| Billing cycle reduction | 25% | Applied only to the admin cost left after the line above, so the two are never counted twice |
| Scheduling efficiency | 20% | Cut from the admin share of payroll only, never from driver wages |
| Route and fuel saving | 12% | A 2025 meta-analysis puts real-world waste-route distance reduction at 12.4%. We chose 12% before looking |
| Annual customer churn | 10% | Waste Management stated roughly 10% on its Q4 2025 earnings call; Republic Services reports 94–95% retention |
| Retention improvement | 10% | Applied to the churning 10% only, never to the whole customer base |
| Admin share of payroll | 20% | Produces $139,000 of back-office labour — 6.7% of revenue. WM disclosed 6.5% and Republic 6.8% for SG&A labour in FY2025 |
| Days sales outstanding | 45 days | Computed from FY2025 SEC filings, the four listed North American haulers run 35.4, 39.5, 41.7 and 49.7 days |
| Collections improvement | 15% | Top-quartile AR teams run 48% lower DSO than the median, so this is well inside what is achievable |
| Cost of capital | 8% | Converts released receivables into a recurring carrying value instead of an annual windfall |
| Contribution margin per job | 30% | What an extra job is worth after disposal and fuel — the only correct multiplier for capacity |
| Cost to replace a customer | $300 | Replacement cost, never lifetime revenue |
| Jobs carrying a billable extra | 20% | Extra rental days, dry runs, overweights, trip fees |
| Average value of an extra | $85 | Blended across the categories above |
| Extras that never reach an invoice | 20% | Independent benchmarking puts manual invoice exception rates at 14% on average, 22% among the weakest performers |
| Share of those recovered | 75% | Capturing the extra at the point of service, not in the office afterwards |
What we left out on purpose
- Added capacity. Worth $37,335 if you can name the demand it fills or the truck it defers. Excluded from the headline because most operators cannot.
- The AI roadmap. Valued at zero throughout.
- Bad debt recovery. Provision for doubtful accounts across the four listed haulers ran 0.10% to 0.34% of revenue in FY2025. Any model offering you a big write-off recovery is working from a rounding error.
- Disposal, depreciation, insurance and financing. Outside the cost model — so do not read a profit margin off this paper.
What would move the answer most
- Your admin spend. The biggest channel is a direct percentage of it. Halve it and the headline falls about 20%.
- Whether you can sell added capacity. A 45% swing on the total, decided entirely outside the software.
- What you are currently failing to bill. We estimated $3.40 a job. Every extra dollar per job adds roughly $3,300 a year at six trucks.
One thing you should know before you evaluate anyone. There is no published, independent, waste-specific ROI benchmark for this software. We looked: G2 lists 136 products under waste management, most with two to six reviews, and not one publishes an ROI or payback figure; TrustRadius, Capterra and Software Advice are the same. Anyone quoting you an industry-standard waste software ROI either built it themselves or borrowed it from another sector.
Sources. The rates above are round illustrative figures chosen for this paper; they are not published benchmarks and contain no pricing or commercial term for CurbWaste or any other vendor. External figures cited: published ROI results from Forrester Consulting Total Economic Impact studies (2019–2025, each commissioned by the vendor evaluated), IDC business-value white papers (2024) and Nucleus Research ROI case studies (2019); buyer-reported payback and category coverage from G2 (2026); accounts-payable and receivable benchmarking from Ardent Partners (2025) and The Hackett Group (2025); route-optimisation meta-analysis, Logistics (MDPI), 2025; Waste Management Inc. investor materials and Q4 2025 earnings call; Republic Services annual reporting; sector transaction counts from Capstone Partners (2026); days sales outstanding, provision for doubtful accounts and SG&A labour computed from FY2025 Forms 10-K filed with the SEC; AI-routing margin contribution as reported by Waste Dive (2026). Of roughly 150 candidate statistics gathered for this paper, 49 were rejected at verification for having no traceable primary source.
All figures are planning estimates built from the stated inputs — not a guarantee of results. Conservative by default: capacity excluded, unbilled work sized at the low end, AI roadmap at zero. Adjust any input that does not match your business. A number built from your own data is the only one worth standing behind.
Ready to get started?
Meet the team to learn more about why CurbWaste waste management software has become the trusted partner for waste hauling businesses nationally.
.svg)

.svg)